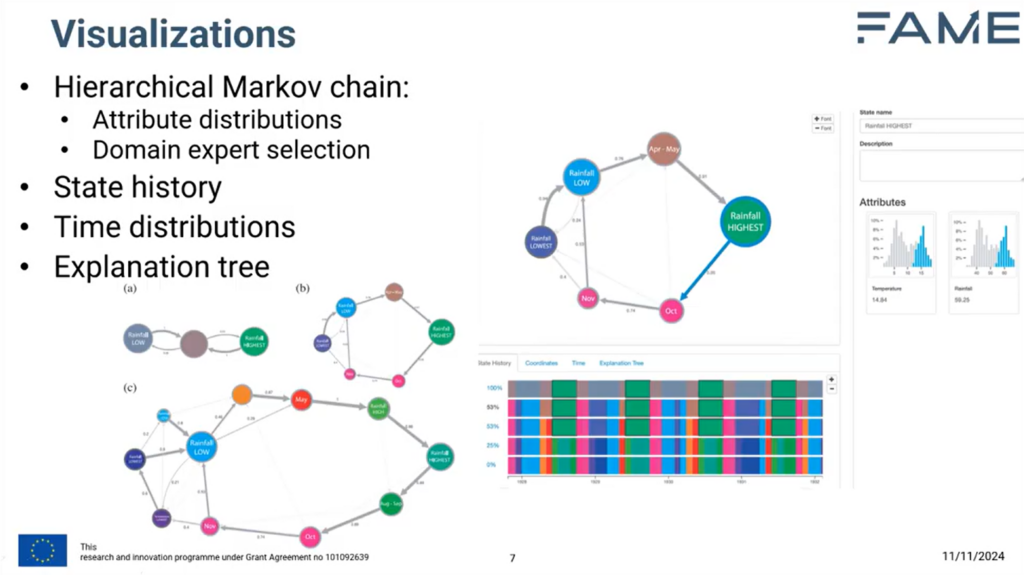
StreamStory is an interactive web-based tool for visualization, exploration and interpretation of multivariate time series data. It was developed by Jožef Stefan Institute (JSI) and is currently undergoing functional upgrades within the FAME project, where large language models (LLMs) are being leveraged to extract and explain patterns. The system helps users identify and investigate recurrent behaviour in temporal data by representing the data as conceptual states and transitions between them.
On November 11th 2024 Jan Šturm from JSI presented StreamStory within the FAME Webinar Series.

What StreamStory Does
StreamStory is designed for analysing complex systems described with multiple time series. It provides summarization by organizing data into states, each representing different conditions of the system, while modelling temporal dynamics and transitions between the states. The system analyses data by representing it as conceptual states, modelling temporal dynamics as transitions between states, supporting exploration at multiple spatial granularities, and providing tools to map abstractions back to domain-specific concepts.
How It Works
StreamStory uses clustering to construct states and represents temporal dynamics as transitions between states using Markov chains. The methodology comprises several steps. First, it constructs a point cloud to represent the multivariate time series. Next, it constructs states by partitioning the ambient space. Then, it models transitions between the states. Finally, it aggregates states and transitions into a hierarchy.
User Interface
StreamStory presents data through three connected panels. The central panel visualizes data as a static graph based on the Markov chain at the current scale. The bottom panel shows a cross-scale historical overview of the dataset. The right panel shows details about selected states. States are visualized as circles with five key visual attributes. The radius encodes proportion of time spent in the state. The position reflects relative position in ambient space. The colour encodes position in hierarchical topology. The label highlights typical properties of the state. The border indicates selection status.
Where StreamStory is Making a Difference
StreamStory is already finding uses in many fields. In manufacturing, it’s being used to predict when machines might need maintenance, potentially reducing the costs by preventing breakdowns. In finance it can help analysts monitor market trends, allowing them to react quickly to sudden changes.
The Power of Turning Data into Stories
StreamStory is a unique tool that turns complex data into easy-to-follow stories. By giving people the ability to see patterns and predict changes, it helps organizations shift from reactive to proactive. No matter the domain, StreamStory is helping people stay one step ahead in an increasingly data-driven world.
We encourage you to watch the recorded webinar session here to dive further into StreamStory.
Read more in the scientific paper:
L. Stopar, P. Skraba, M. Grobelnik and D. Mladenic, “StreamStory: Exploring Multivariate Time Series on Multiple Scales,” in IEEE Transactions on Visualization and Computer Graphics, vol. 25, no. 4, pp. 1788-1802, 1 April 2019, doi: 10.1109/TVCG.2018.2825424.
Authors: Tanja Zdolšek Draksler and Jan Šturm, JSI
—
Subscribe to our newsletter for the latest updates, and follow FAME on LinkedIn and X to be part of the journey.
More info:
Jozef Stefan Institute
